Carbon Footprint
As a service provider, our activities have relatively low environmental impacts. Nevertheless, we keep an eye on our carbon footprint. Business travel has been the dominant contribution in our carbon foot print over the years. A switch to Green Power in FY2014 has resulted in a significant reduction of total greenhouse gas emissions.
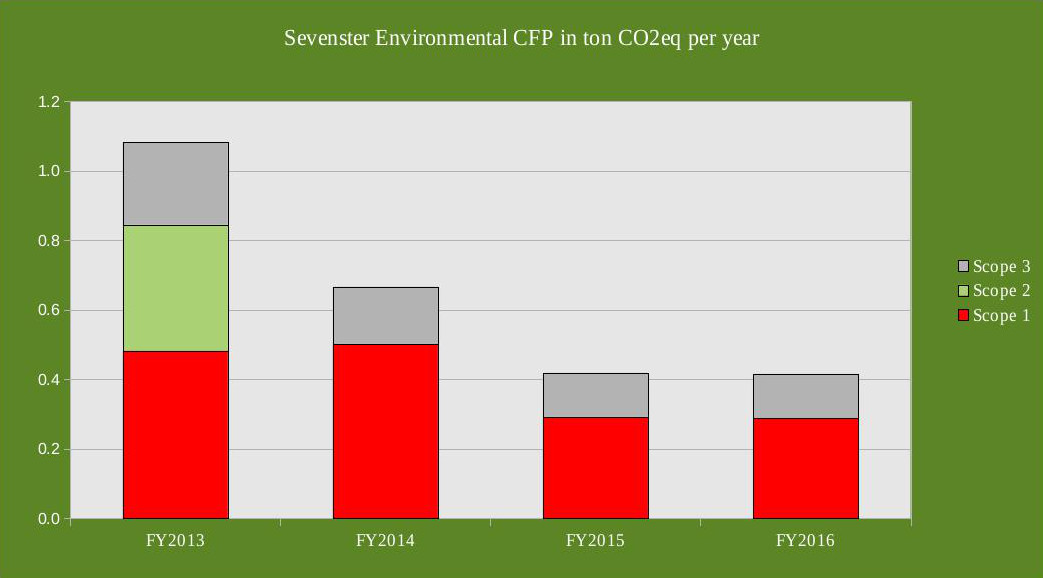
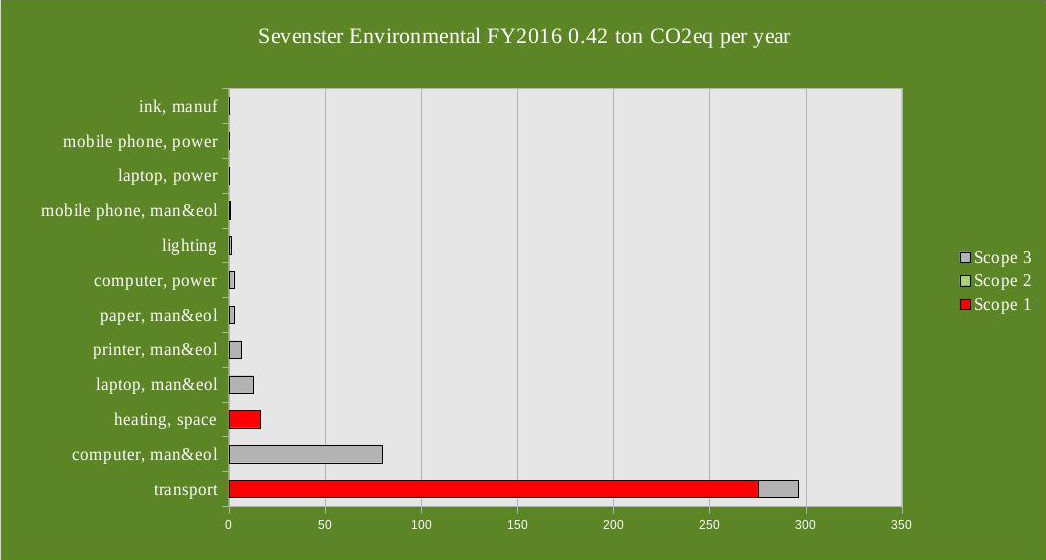
Over financial year 2016, the footprint was virtually the same as over FY2015. A slight increase in business travel was off set by the use of a more efficient vehicle.
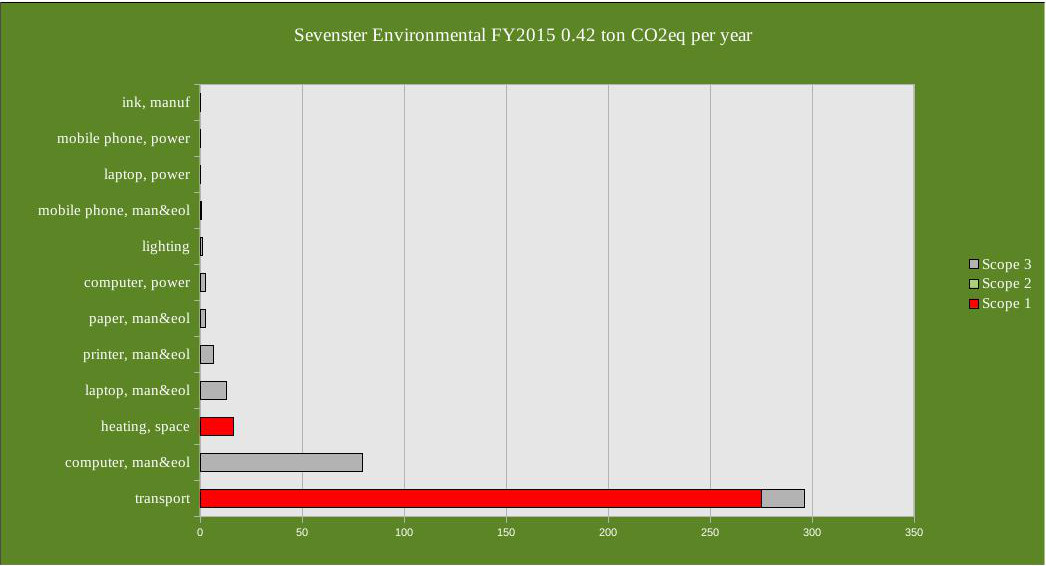
Over financial year 2015, footprint was lower due to reduced business travel but transport is still the dominant contribution. With extended life times for computer, laptop and mobile phone the contribution of manufacturing and end of life have also reduced (man&eol stands for manufacturing and end of life).
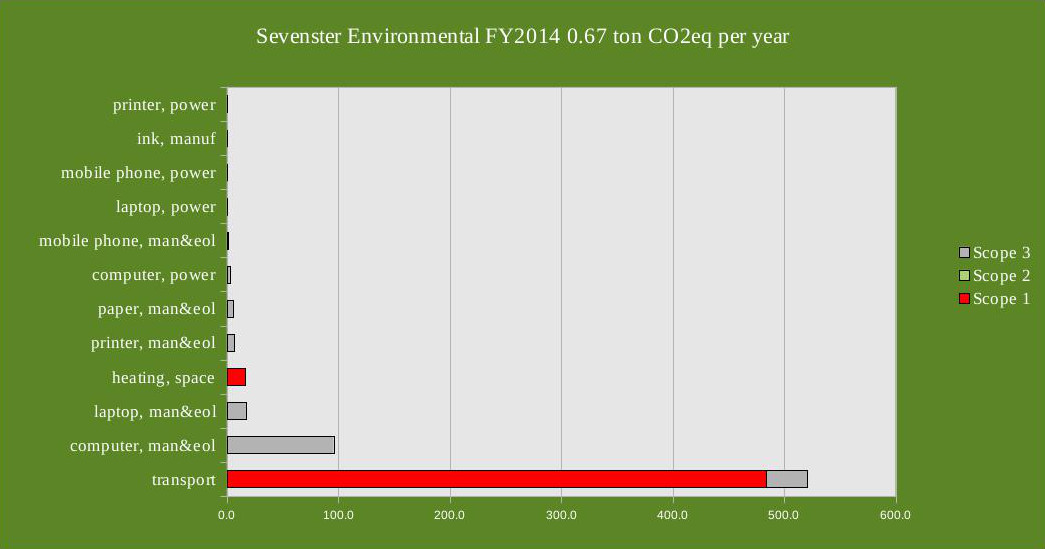
Over financial year 2014, footprint was significantly reduced by the use of green power and wood heating. Transport is again the dominant contribution. There is still a Scope 3 component to electricity use as well as emissions associated with the burning of wood, but the reduction compared to standard grid power is considerable (man&eol stands for manufacturing and end of life).
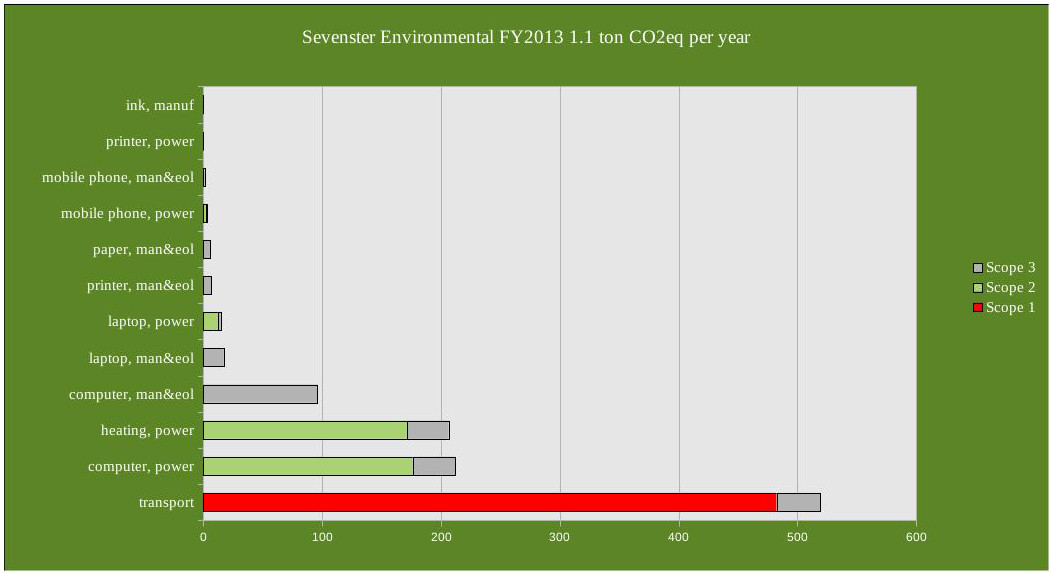
Our CFP over the 2013 financial year indicates that transport is the biggest contributor despite frequent use of public transport. Next contribution is from power consumption (computer, heating). Embodied emissions associated with electronic equipment are also a considerable factor (man&eol stands for manufacturing and end of life). Almost half of the emissions are part of the so-called Scope 3 and thus associated with sources other than direct energy use.